Hello, Meadow.Cloud

Step 1 - Create a Wilderness Labs account
To access all Meadow.Cloud features, you first need to sign up to create an account if you dont have one.
Step 2 - Provision a Device
Before a device can enjoy things like Over-the-Air updates and Health Monitoring, it needs to get provisioned with Meadow.Cloud. This is a straightforward process with a few command-line steps:
You'll need to install the Meadow.CLI to interact with Meadow.Cloud commands.
Use the Meadow.CLI to authenticate with Meadow.Cloud:
meadow cloud loginThis opens a browser with the Wilderness Labs Login page. After authenticating, you can go back to the terminal and it should confirm you've successfully logged in.
Connect your Meadow device to your development machine if you havent and enter the following command to make sure we'll provision the device you just connected:
meadow port selectNow lets provision the device for Meadow.Cloud. Use the following command below. Adding a device name with the
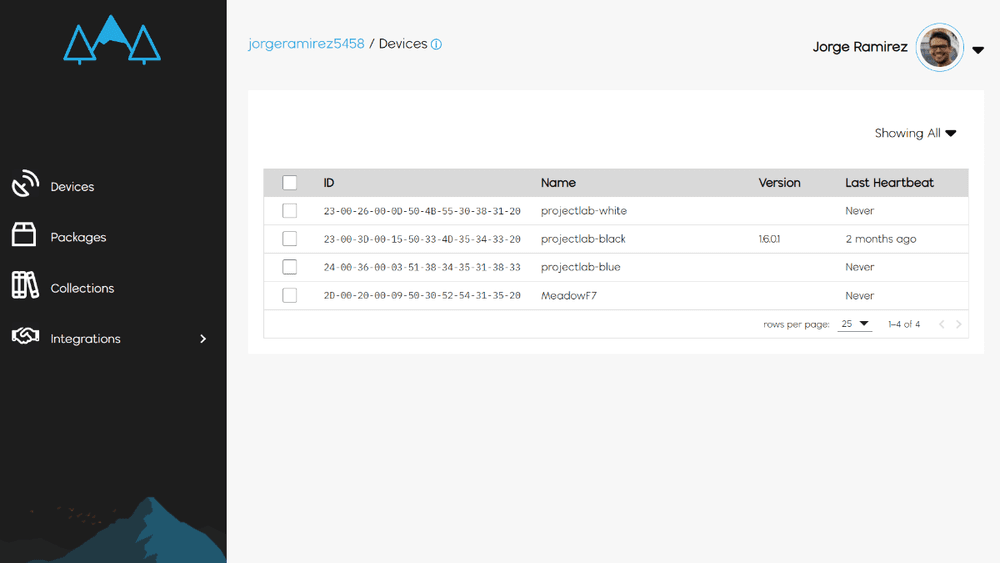
--nameparameter is optional, but will make it easier to identify your device later.meadow cloud device provision --name FeatherF7After confirming that the Meadow device has been provisioned, you can go to https://www.meadowcloud.co to verify your device has been successfully provisioned.

Step 3 - Enable Meadow.Cloud integration in a Meadow App
Lets verify that you have provisioned your device and interacts properly to Meadow.Cloud. In order to do that, let's set your device to enable Health Metrics. With Meadow, this is a first class feature and simple to set up. Once enabled, you can see the status of your device at a glance. Additionally, you can drill down to see raw data as well as basic charts to view the data over time.
Open an existing Meadow app project, or follow the Hello, F7 Feather to make one from scratch.
The board will to join a WiFi network at startup, so you'll need to update a few network settings in the
meadow.config.yamlfile:# Control how the ESP coprocessor will start and operate.
Coprocessor:
# ESP32 automatically attempt to connect to an access point at startup
# If set to true, wifi.yaml credentials must be stored in the device.
AutomaticallyStartNetwork: true
# Should the ESP32 automatically reconnect to the configured access point?
AutomaticallyReconnect: true
# Maximum number of retry attempts for connections etc.
# before an error code is returned.
MaximumRetryCount: 7
# Network configuration.
Network:
# Default Interface
DefaultInterface: WifiEnter your WiFi's SSID and Password credentials in the
wifi.config.yamlfile:# WiFi network credentials
Credentials:
# WiFi SSID
Ssid: WIFI_SSID
# WiFi Password
Password: WIFI_PASSWORDFinally, setting up health monitoring requires the following update in
app.config.yaml:# Meadow.Cloud Health Metrics.
HealthMetrics:
# Enable Health Metrics
Enabled: true
# How often to send metrics to Meadow.Cloud (in minutes)
Interval: 3Now run the app and eventually logs into Meadow.Cloud, and it'll start sending device health metrics to your account. The app's output should look similar to this:
...
starting health metrics timer
Attempting to login to https://www.meadowcloud.co/api/devices/login with {"id":"2D-00-20-00-09-50-30-52-54-31-35-20"}...
authentication successful. extracting token
decrypting auth payload
auth token successfully received
making cloud log httprequest with json: {"eventId":10,"description":"device.health","measurements":{"health.cpu_temp_celsius":42.6996336996337,"health.memory_used":574024,"health.disk_space_used":11646602,"info.os_version":"1.8.0.0","health.battery_percentage":0,"info.coprocessor_os_version":"1.8.0.0"},"timestamp":"2024-01-31T18:54:03.123871+00:00"}
cloud send success
health metrics sent
making cloud log httprequest with json: {"eventId":10,"description":"device.health","measurements":{"health.cpu_temp_celsius":39.7985347985348,"health.memory_used":911184,"health.disk_space_used":11646602,"info.os_version":"1.8.0.0","health.battery_percentage":0,"info.coprocessor_os_version":"1.8.0.0"},"timestamp":"2024-01-31T18:57:02.149871+00:00"}
cloud send success
...
Step 4 - Verify logs in Meadow.Cloud
Lets take a check the new device health logs coming in:
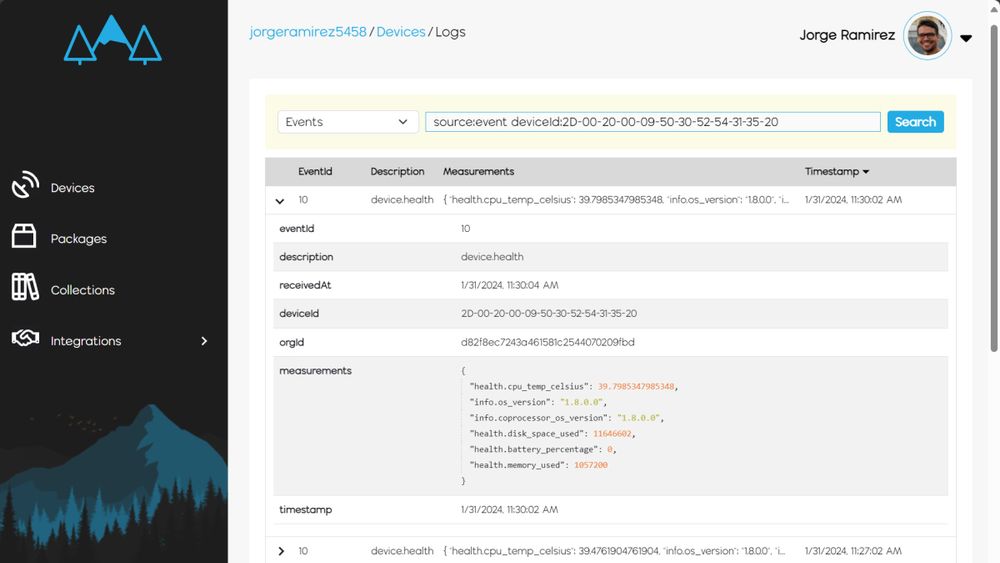
In the Meadow.Cloud site, hover your cursor your device in the Devices section, and click on Logs.
Click on the type of log drop-down menu and select
events, and a list should appear with your device's health status, showing you disk space used, cpu temperature, memory used and battery percentage if present.